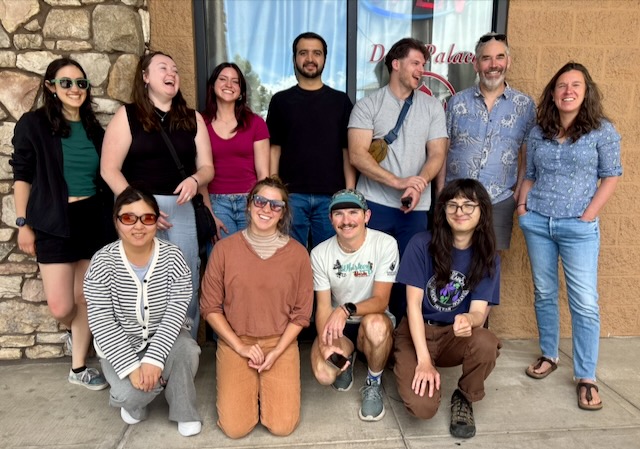
To celebrate the end of the semester, Andrew and Mariah took the lab group out to lunch at Delhi Palace. You can’t go wrong with garlic naan and a big plate of rice and curry!

Terrestrial Ecosystem Ecology
To celebrate the end of the semester, Andrew and Mariah took the lab group out to lunch at Delhi Palace. You can’t go wrong with garlic naan and a big plate of rice and curry!
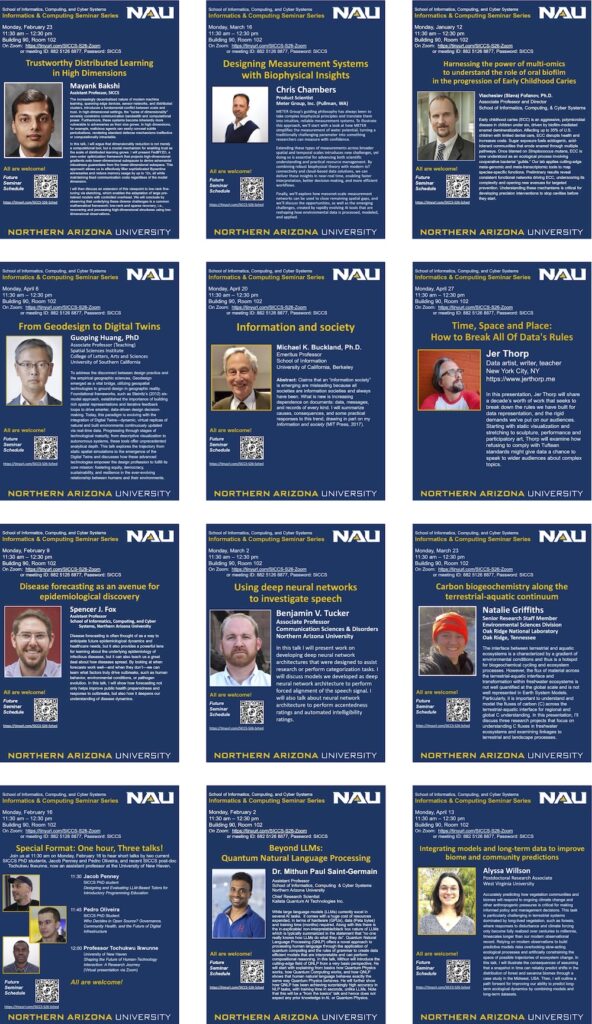
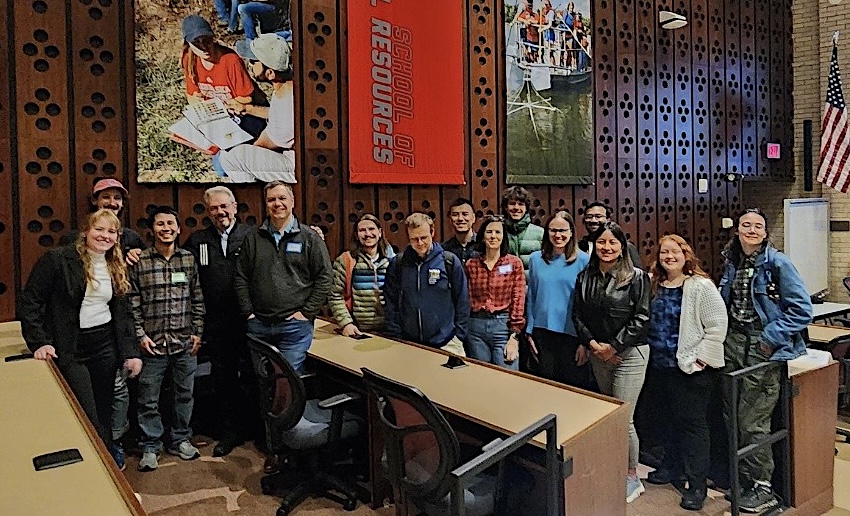
On April 27, we wrapped up the last SICCS Informatics & Computing Seminar of the spring semester with another great talk — data artist Jer Thorp talking about his amazing work over the last decade, from public installations to compelling visualizations. Along the way we heard about a wide range of computing and interdisciplinary topics, including machine learning (e.g., trustworthy distributed learning, deep neural networks, natural language processing) and data science applications. Speakers highlighted applications of computing in science and society, such as epidemiology, bioinformatics, geospatial systems, environmental science, and microbiome research. In addition, the series explored broader themes like information theory, data visualization, human-centered computing, and the societal impact of technology.
Thanks to SICCS Director Fofanov and SCE Dean Chadwell for supporting our visiting speakers this semester.
See you in the fall!
In May, Darby flew to Germany to spend two weeks at the Max Planck Institute for Biogeochemistry in Jena. She was hosted by Carlos Sierra and MPI Director Sue Trumbore. Working 1-on-1 with Carlos enabled Darby to make some great progress on modeling her soil 14C data from Hubbard Brook using the SoilR package. Darby gave a presentation on her work while she was there, and also met many of the other scientists working at MPI.
The GIF below shows Darby having some fun with MPI Director Markus Reichstein.
For quite a few years, the lab has been using METER Group’s all-in-one meteorological sensor, which measures air temperature, relative humidity, solar radiation, precipitation, wind speed and direction, barometric pressure, lightning strike frequency and distance, and sensor tilt. We’ve had many of these instruments installed at sites in Arizona, Colorado, and New Mexico, for both long-term installations and short-term measurement campaigns.
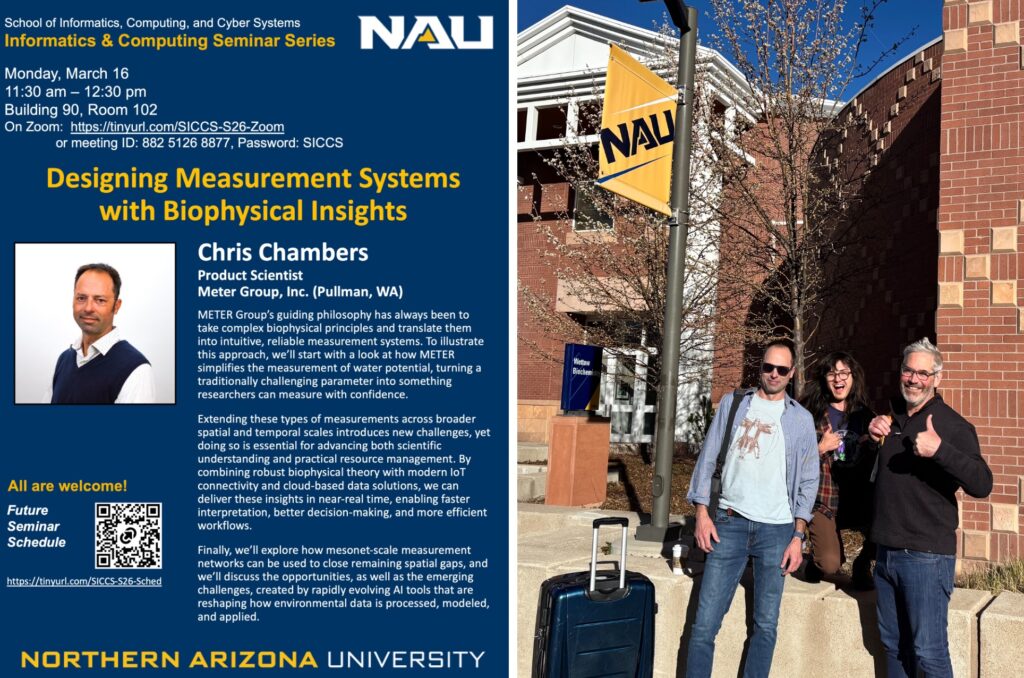
In mid-March, we had a visit from Chris Chambers and Carol McFarland from METER Group (formerly Decagon Devices). Chris gave a talk in the SICCS Informatics and Computing Weekly Seminar on “Designing measurement systems with biophysical insights”, and then after lunch at Martanne’s Burrito Palace, Chris and Carol held an “Office Hours” session where they were able to show off some of their new products to the NAU community. We then took a break for a well-attended happy hour “science session” at Mother Road.
After the visit, Carol noted that “it was lovely to learn more about your work, connect with some of your colleagues, enjoy some Flagstaff highlights, and meet your fantastic group of graduate students!”
Thanks to you both, Carol and Chris, for a fun and informative visit!
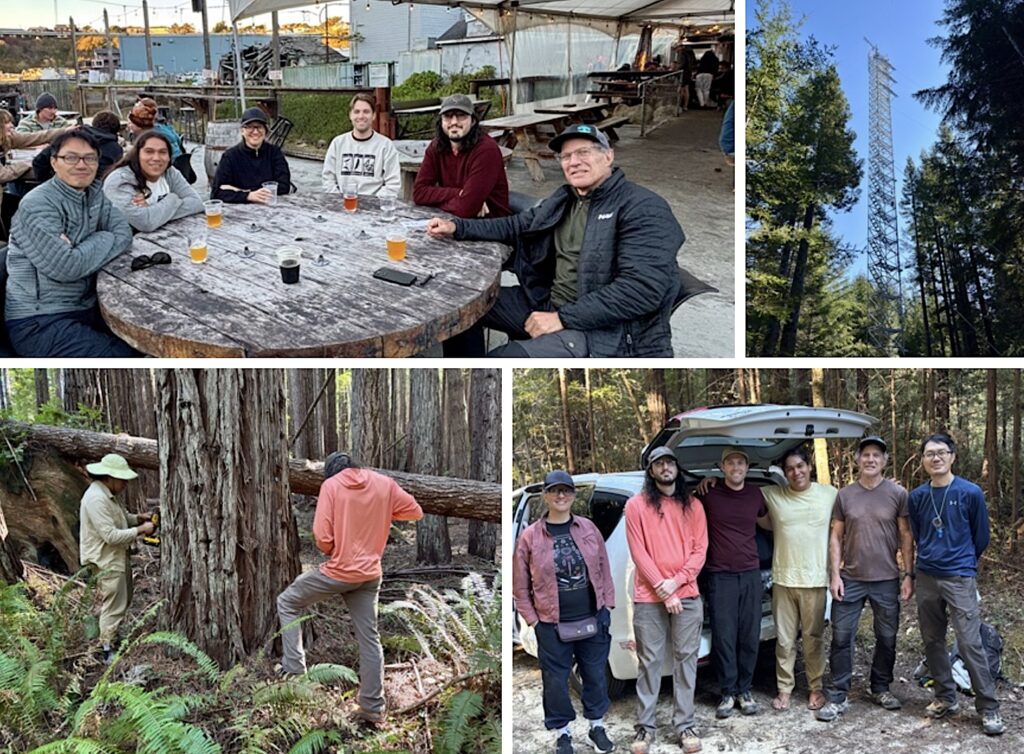
Andrew and George Koch traveled to Mendocino County, California, to meet up with colleagues from Lawrence Berkeley National Laboratory and UC Davis at the new redwood flux towers at Jackson Demonstration State Forest near Fort Bragg. With help from Housen Chu (LBNL) and Kosana Suvocarev (UC Davis), and their talented field crew, Andrew and George managed to get 61 automated point dendrometers and 11 soil moisture sensors installed within the footprints of the Parlin and Mitchell towers. Former Richardson Lab visitor Deklan Mengering is now part of the UC Davis team, and UC Davis PhD student Lily Klinek (who visited NAU in January) also showed up to lend a helping hand.
A special bonus was the visit by Dr. Aaron Teets (NAU PhD 2022), who dropped by at the end of the trip for a seafood dinner with Andrew and George.
Thanks to everyone who helped make this a remarkably successful outing!
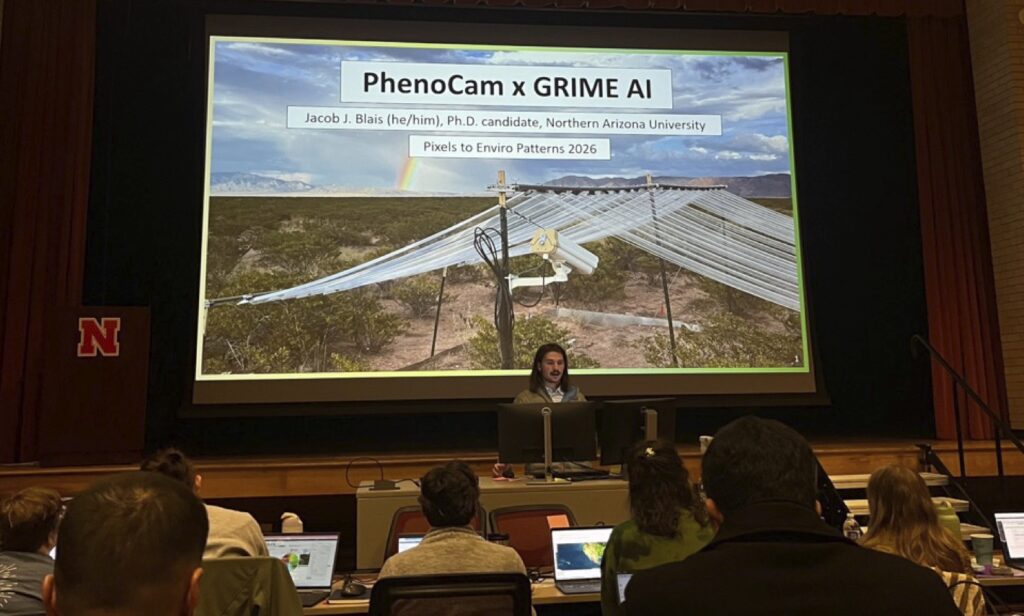
Over spring break, Jacob, Camelia (undergraduate in Computer Science), and Mike (PhenoCam Team / Advanced Research Computing) traveled to Lincoln, Nebraska for Pixels to Enviro Patterns (PEP) 2026. Hosted at the University of Nebraska-Lincoln, PEP 2026 was an NSF-funded science and storytelling workshop based around the powerful and continuously-evolving software called GRIME AI. Jacob, Camelia, Mike, and others have been working together on a project that leverages GRIME AI to use dynamic, instead of static, vegetation masks to derive phenological information from PhenoCam imagery of Jacob’s field sites in New Mexico. Development of GRIME AI is funded by an NSF Geoinformatics grant awarded to Dr. Troy Gilmore at the University of Nebraska-Lincoln. Andrew is a co-PI on the grant.
The workshop consisted of presentations about using time-lapse imagery and artificial intelligence technology for hydrological and ecological teaching and research. After returning to Flagstaff, Jacob noted that “seeing old friends and making new ones, and learning about cutting-edge science, really made the trip a treat!”
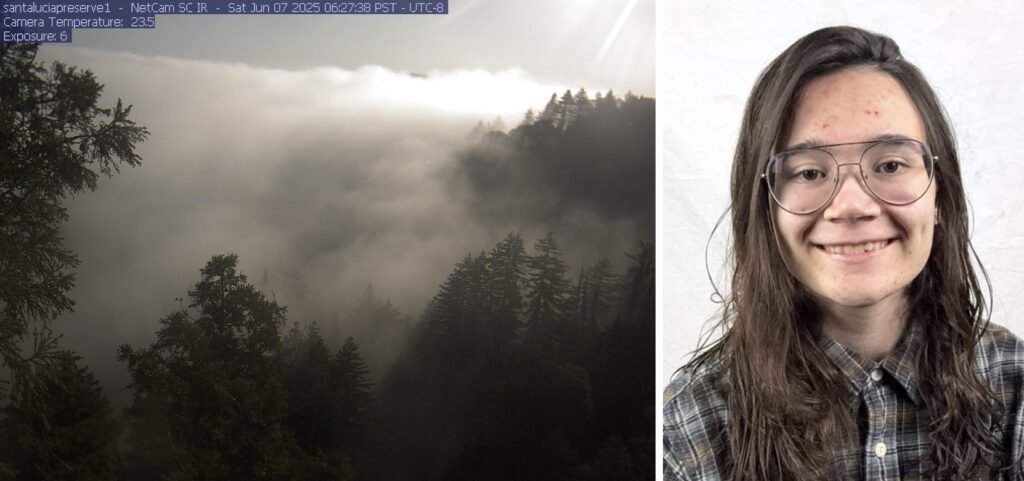
During the fall semester, Camelia Mosor, Computer Science major and undergraduate in the ESSTE program in Ecoss, learned about potential applications of AI-based tools to assist with analysis and interpretation of PhenoCam imagery. Her interest led to working with Jacob on annotation of images from his work at the Sevilleta Mean-Variance Experiment in New Mexico. Now Camelia has a project that is all her own—she was just awarded a $6500 grant from the Save-the-Redwoods League for her proposal, Automated Fog Detection in Coast Redwood Forests. Mentored by George Koch and Andrew, Camelia’s project will develop and train a machine learning model to detect the presence of fog in phenocam imagery at 4 research sites in George and Andrew’s Redwoods Observatory Network. She will then use the model to describe recent fog history and relate it to other sensor-based indicators of fog at sites in Monterey County, Santa Cruz County, Sonoma County, and Del Norte County.
Congratulations, Camelia, on this fantastic achievement!
The fog comes
on little cat feet.
It sits looking
over harbor and city
on silent haunches
and then moves on.
— Carl Sandburg
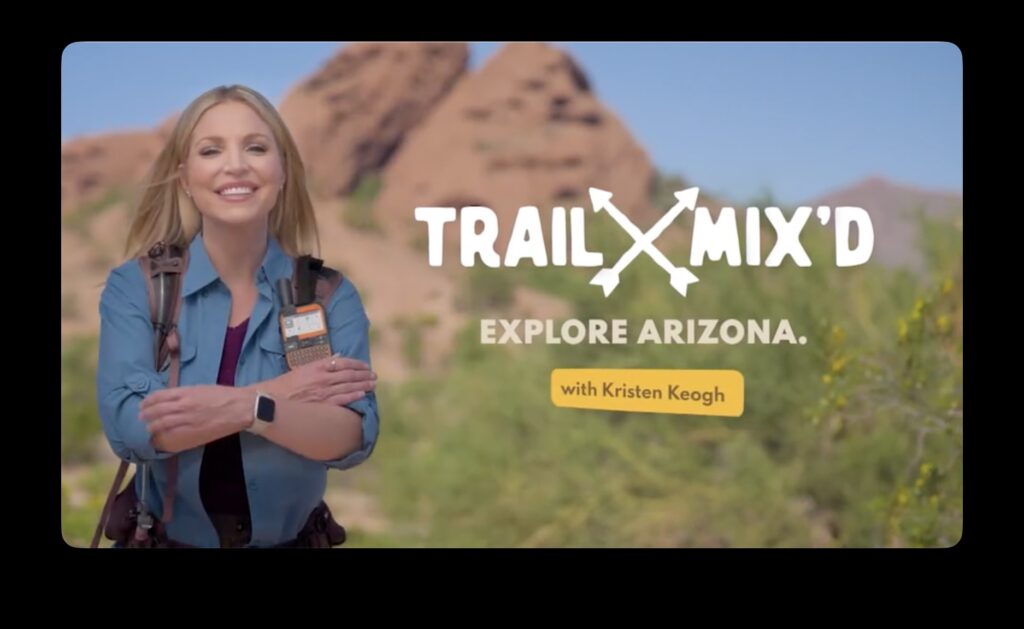
Check out the latest episode of the PBS show, “Trail Mix’d” to see Andrew talking with host Kristen Keogh about the trees on Humphrey’s Peak!
Andrew is coauthor on a Tansley Review just published in New Phytologist, “Carbon uptake, storage, and allocation patterns contribute to blurring of annual 14C signals in tree rings.” Led by Amy Hessl, a paleoclimatologist at West Virginia University, the paper reviews how trees take up, store and use carbon and how these processes can affect the timing and strength of the radiocarbon “spikes” left behind in the atmosphere by past solar storms, known as Miyake events. The paper emerged from a new NSF-funded collaboration between Hessl and Prof. Mariah Carbone.
Modeling led by Andrew and Mariah shows how tree biology has a fundamental impact on how faithfully the atmospheric signal is preserved. Andrew noted that “This study has a lot of implications for applications of carbon dating in fields such as archaeology, for example, as well as the use of radiocarbon in tree rings to reconstruct historical patterns of atmospheric radiocarbon.”
Ecoss visual artist Victor Leshyk contributed a brilliant illustration that captures the underlying processes, reproduced below.
There is a write-up about the paper in the NAU Review.

After meeting up with Andrew and George Koch in Sonoma County earlier this month, Lily Klinek made a visit to NAU to talk more about redwoods and—and to learn more about the dendrometer measurements, supported by Save the Redwoods League, that Andrew and George have been making at sites from Del Norte county to Monterey County. Lily will be including these data in a range-wide synthesis of the timing and environmental sensitivity of redwood tree growth.
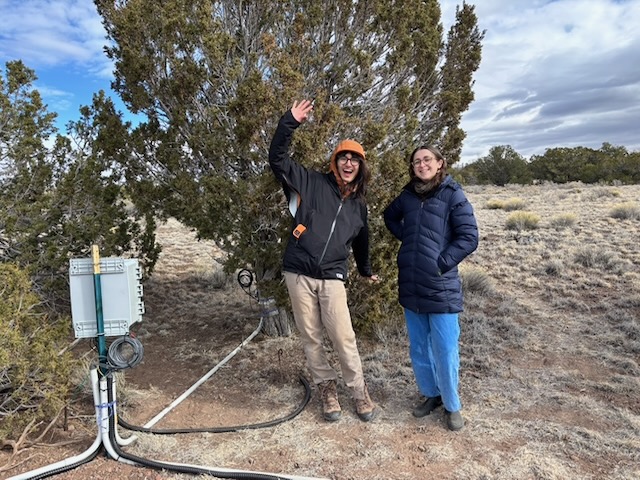
Lily had a chance to enjoy multiple social activities and get-togethers, including happy hour at Historic Brewing, a trip to Oscar’s “Blue Chute” pinyon-juniper field site (top photo), a hike into the cinder cone of Red Mountain, and a day trip to the Grand Canyon.